(click for the full-size image)
July 31, 2003
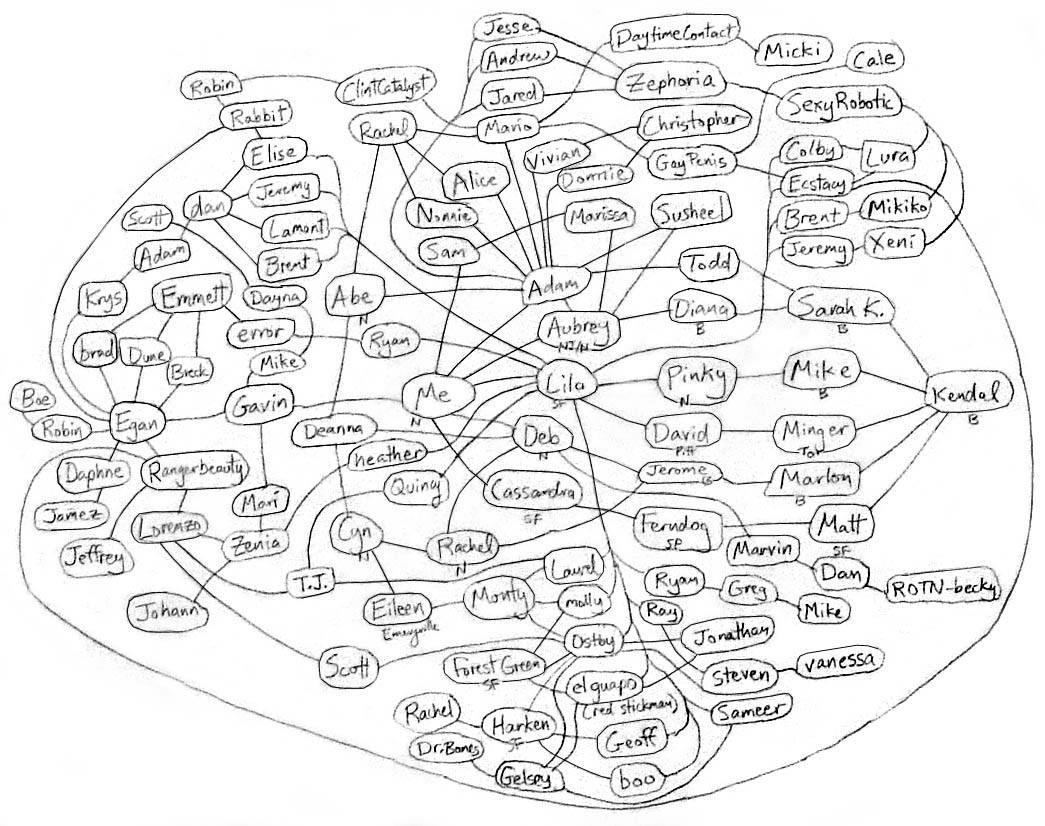
Much like my graphs of 1997, i tried hand-graphing the friendster network around me. With only 12 friendsters, this is only a tiny fragment of the 110305 people in my 'personal network'.
(click for the full-size image)
Since there is no software that does this (...yet...) i drew it with pencil on paper, then took a picture with my digital camera and cleaned it up on PhotoShop. Basically, i manually clicked around the network, recording paths between my own Friendster ID and others. Because Friendster only tells me the path from myself, this graph is missing a lot of the connections between people that don't go through me.
To find interesting people to add to the graph, i did a search on interests, e.g. "entheogens", looked at the path to each person that resulted. Then, if there was room on the paper, i drew them in.
Because there are amazing friend-of-friend connections that i could never grasp by just clicking around the (slow...) Friendster site directly. Because of the fundamental human desire to see the big picture.
It turns out that many of the most well-connected Friendster hubs are not people. There are Friendster IDs created for a whole host of non-human entities, including cities (San Francisco has only 84 friends?), drugs (Ecstasy has a lot of friends.... Ketamine fewer) and body parts (Gay Penis is wildly popular).
The last time that drawing a network like this was possible was in the mid-90s, when personal homepages were still an exciting new phenomena. People would create a site, and link to their friend's sites - before the the web got cluttered and crazy, you could actually observe social network by browsing personal sites and recording links. That's how i made my graphs of 1997, but such a thing would be nearly impossible today.
I desperately wished there was software that would walk my network for me, and draw the graph - capturing all the interpersonal links, and display could be set to limit by number of hops (a.k.a. "degrees of separation") You could optionally show the pictures in the graph, and each ID would be clickable to go directly to their page. I know how to do it... finally i just wrote the spider...